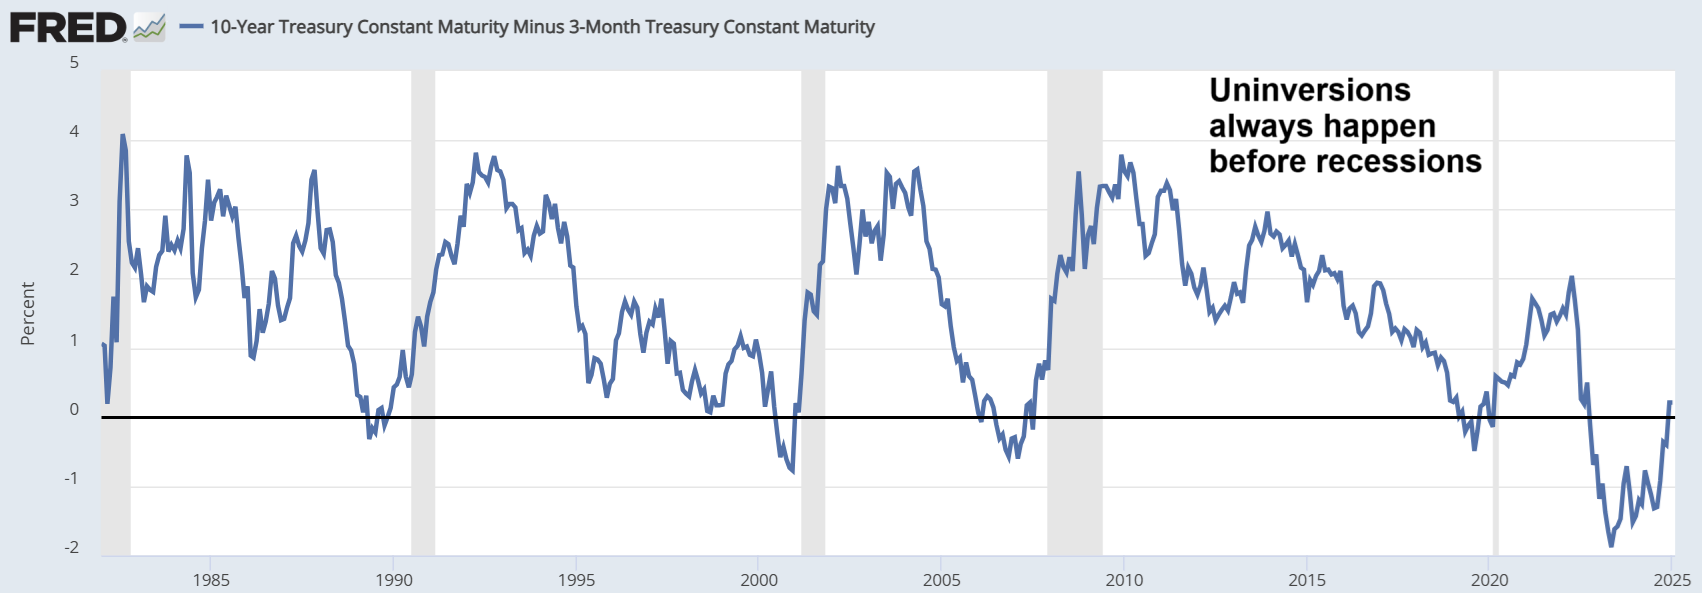
As you can see, the uninversion of the 10y-3m Treasury yield curve is here, and universions always happen before recessions. Interestingly, this is happening at a time when many aspects of the US economy look strong. The video linked below provides a brief discussion on this a few other related issues.