Showing posts with label inversion-recession phenomenon. Show all posts

Wednesday, October 29, 2025

The inescapable signal of a Fed rate cut

The Federal Reserve maintains a consistent, albeit uncomfortable, doctrine: it does not cut the short-term Federal Funds Rate into a demonstrably strong economy. An easing of monetary policy is fundamentally at odds with an environment characterized by robust GDP growth, tight labor markets, and persistent inflationary pressures. When the economy is performing optimally, the central bank’s primary concern remains stability and price control, necessitating a neutral or restrictive stance. Therefore, the first rate cut following a significant tightening cycle should never be viewed as a reward for economic strength. Instead, it is a signal—a tacit admission by the Federal Open Market Committee (FOMC) that the prior restrictive policy has finally slowed demand sufficiently, and that the underlying economic momentum is beginning to stall. It is the central bank acknowledging that the risk has officially shifted from inflation to unemployment and contraction.

This critical signaling function leads directly to the next point: for each quarter-point reduction, the statistical probability of a recession in the very near future noticeably increases. A 25-basis point cut is rarely a pre-emptive, surgical strike; it is often a reactive measure taken when leading indicators, or even coincident data, begin to seriously falter. The Fed is not merely easing; it is attempting to manage a deterioration that has already begun. The deeper the central bank is forced to cut—moving from an initial 'insurance' cut to a pattern of successive, reactive cuts—the more apparent it becomes that the economic ailment is severe. These incremental reductions, therefore, function less as instant stimulus and more as a lagging indicator of accelerating risk, confirming that the central bank’s restrictive measures finally broke something critical in the economic engine.


History offers a chilling confirmation of this pattern, which holds true almost all the time. Since the early 1970s, nearly every significant Fed easing cycle that followed a sustained period of rate hikes has culminated in, or immediately preceded, a recession. The initial cuts that mark the beginning of an aggressive easing phase are typically followed by a full-blown economic downturn within the subsequent 12 to 18 months. While policymakers and commentators occasionally dream of achieving a perfect 'soft landing,' the data suggests that once the Fed has tightened enough to necessitate a decisive pivot to cutting, the underlying damage is already done, and the recessionary forces have been unleashed. Prudent investors must view the commencement of a rate-cutting cycle not as a cause for celebration, but as a definitive, high-confidence warning sign that the economy is transitioning into a high-risk phase.

Wednesday, May 28, 2025

Yield curve inversions, un-inversions, and US recessions

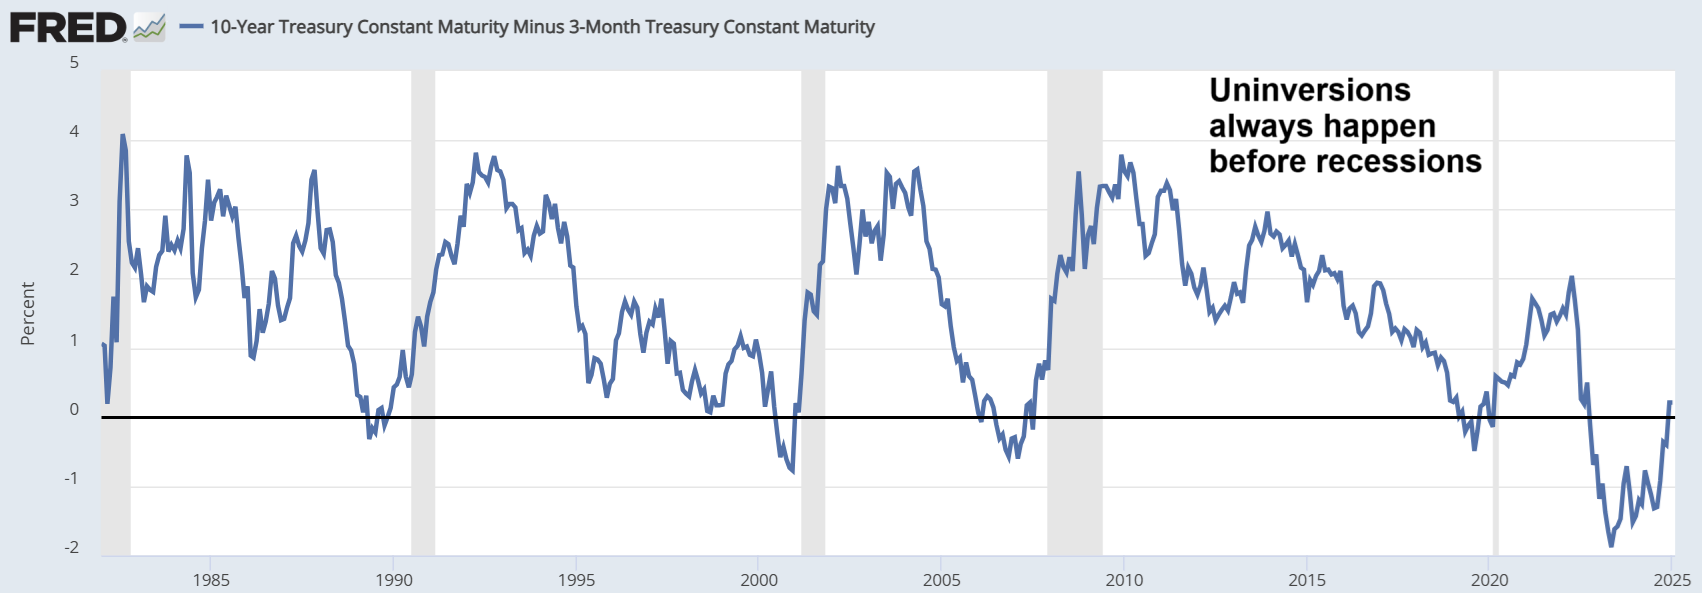
The figure below (source: Federal Reserve Bank of St. Louis) displays the spread between the 10-year and 3-month U.S. Treasury yields from the early 1980s through 2025. This yield spread is a closely watched indicator in financial markets, as it reflects investor expectations about future economic conditions. A yield curve inversion—occurring when the spread falls below zero, meaning short-term interest rates exceed long-term rates—has historically been associated with upcoming recessions. Economists and policymakers often regard this inversion as a reliable leading indicator, given its strong track record in signaling economic downturns with a lead time of several months to over a year. As shown in the graph, each sustained inversion over the past four decades has typically preceded a recession, underscoring its continued relevance in macroeconomic forecasting.


It is important to note that the yield curve typically un-inverts, or returns to a positive slope, before a recession actually begins. In the graph, recessions are represented by the shaded areas, and a close examination reveals that the un-inversion often precedes the onset of these downturns. However, the time gap between the un-inversion and the start of a recession can vary significantly, ranging from a few months to over a year. This variability highlights the complexity of using the yield curve as a precise timing tool, even though it remains a valuable early warning signal. For a brief discussion on this pattern, along with a few other related topics, please refer to the video linked below.

Tuesday, January 28, 2025

The yield curve uninversion is here

The figure below shows the graph of the 10y-3m Treasury yields for the period going from the early 1980s to 2025. The inversion in the 10y-3m graph is the best indication of an impending economic recession in the US, and that graph uninverts immediately prior to a recession.


As you can see, the uninversion of the 10y-3m Treasury yield curve is here, and universions always happen before recessions. Interestingly, this is happening at a time when many aspects of the US economy look strong. The video linked below provides a brief discussion on this a few other related issues.

Saturday, September 16, 2023

How many times until a coincidence becomes a pattern? The case of yield curve inversions preceding recessions and the magical number 7

Let us say that a coincidence involving two events, where one seems to predict the other, happens a number of times. How many times until it can be considered not only a coincidence, but a statistically significant pattern? We propose a framework to answer this question. Using the framework, we find that the number of times required is 7. We illustrate the practical application of our framework in the context of a very important phenomenon: When the percentage difference between 10-year and 3-month U.S. Treasury yields falls below zero, a U.S. recession appears to occur within the next 18 months.

All of this is laid out in much more detail in the article linked below. In this article, we have established the minimum number of times required for the inversion-recession phenomenon to be deemed more than a coincidence, and rather a statistically significant pattern. That number is 7. Therefore, given that since 1970 we have observed 8 instances of the inversion-recession phenomenon, we can conclude that this not a coincidence, and that it is in fact a statistically significant pattern.

https://www.tandfonline.com/doi/full/10.1080/03610926.2023.2232908

The video below complements this post, by briefly addressing some of the issues discussed in the post.