This blog is about data analytics, statistics, economics, and investment issues. The "Warp" in the title refers to the nonlinear nature of investment instrument variations.
The figure below shows two simulation-based valuations of the S&P 500. They assume a fair price-to-earnings (PE) ratio for the S&P 500 that is the inverse of half of the 10-year U.S. Treasury yield. The price (at the top) is the most recent top value of the S&P 500.
The numbers on the left consider a more benign scenario: S&P 500 earnings in 2025 are up by 13% from the previous year, and the 10-year U.S. Treasury yield is at 3.61%. The numbers on the right refer to a less positive scenario: S&P 500 earnings are up by 6%, and the 10-year U.S. Treasury yield is at 4.17%.
The second scenario takes us to a fair price for the S&P 500 of 2,673.79, which is 56.48% down from the most recent high. The video linked below discusses these simulations, some of the most recent values for the simulation inputs, and a few other things.
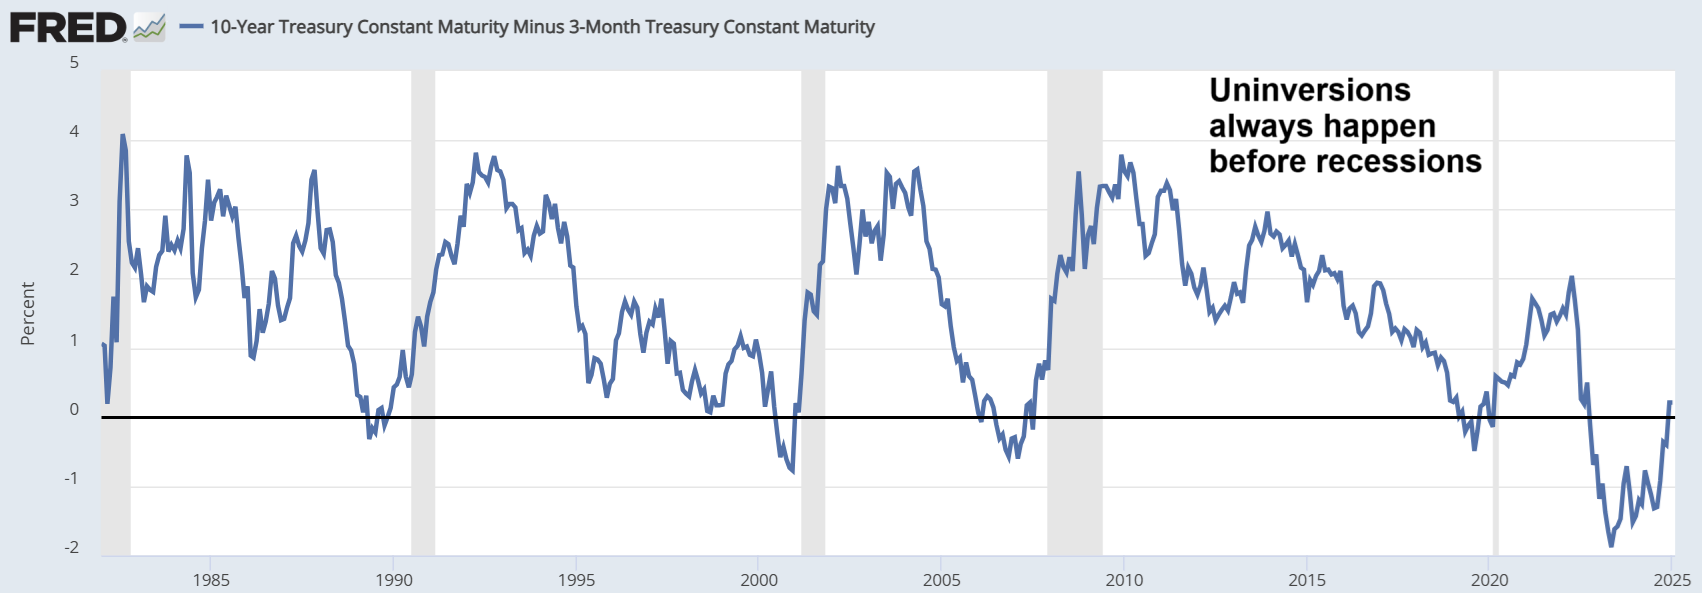
The figure below shows the graph of the 10y-3m Treasury yields for the period going from the early 1980s to 2025. The inversion in the 10y-3m graph is the best indication of an impending economic recession in the US, and that graph uninverts immediately prior to a recession.
As you can see, the uninversion of the 10y-3m Treasury yield curve is here, and universions always happen before recessions. Interestingly, this is happening at a time when many aspects of the US economy look strong. The video linked below provides a brief discussion on this a few other related issues.
The figure below shows five values of the TLT exchange-traded fund, which tracks the value of Treasury bonds with maturities of 20 years or more (i.e., long Treasuries), and of the corresponding 10-year Treasury yields. The latter, 10-year Treasury yields, are highly correlated, in a lagged way, with the Federal Funds rate. This rate is set by the Fed.
As you can see from the best fitting line equation, there is an increase of approximately 19 points in the value of the TLT for each 1% decrease in the 10-year Treasury yields. So, if the Federal Funds rate us expected to go down, the gain likely to be obtained by investing in long Treasuries in quite attractive. The video linked below provides a brief discussion on this a few other related issues.
The figure below shows the adjusted three-month moving average of the national unemployment rate in the U.S. for the past 12 months, with the minimum and current values indicated at the bottom-left and top-right areas. This is known as the Sahm Recession Indicator, which signals the start of a recession when the it rises by 0.50 percentage points or more relative to its minimum value in the previous 12 months. The Sahm Recession Indicator has been named after economist Claudia Sahm.
If the adjusted three-month moving average of the national unemployment rate, or the the Sahm Recession Indicator, continues rising at the same rate, we should either be in recession right now in August 2024, or enter a recession within the next few months – according to the Sahm Rule, which is based on the Indicator. The video linked below provides a brief discussion on this a few other related issues.
The figure below shows two simulation-based valuations of the S&P 500. They assume a fair price-to-earnings (PE) ratio for the S&P 500 that is the inverse of half of the 10-year U.S. Treasury yield. The price (at the top) is the most recent top value of the S&P 500.
The numbers on the left consider a more benign scenario: S&P 500 earnings in 2024 are up by 12.10% from the previous year, and the 10-year U.S. Treasury yield is at 4.28%. The numbers on the right refer to a less positive scenario: S&P 500 earnings are up by 9.90%, and the 10-year U.S. Treasury yield is at 4.28%.
The second scenario takes us to a fair price for the S&P 500 of 2,843.17, which is 49.37% down from the most recent high. The video linked below discusses these simulations, some of the most recent values for the simulation inputs, and a few other things.
The figure below illustrates a truth that most investors know, but tend to forget. Taking high levels of risk in the financial markets increases the tail probabilities, which are associated with massive gains and massive losses. The lure of high-risk decisions and related investment instruments often acts as a sort of tax on the statistically illiterate.
But investors can reduce the chances that they will end up at the left tail end of the probability distribution. When it comes to stock investing, paying attention to two events can help. The first is the percentage difference between 10-year and 3-month U.S. Treasury yields falling below zero, because a U.S. recession tends to occur within the next 18 months.
The second is the stock market, measured by an index such as the S&P 500, reaching a double-top within that that period of 18 months after the percentage difference between 10-year and 3-month U.S. Treasury yields falls below zero. This combination is extremely bearish. And this is where we are about now. The video linked below discusses this in a bit more detail.
The figure below shows two simulation-based valuations of the S&P 500. They assume a fair price-to-earnings (PE) ratio for the S&P 500 that is the inverse of half of the 10-year U.S. Treasury yield. The price (at the top) is the most recent top value of the S&P 500.
The numbers on the left consider a more benign scenario: S&P 500 earnings in 2023 are up by 3.20% from the previous year, and the 10-year U.S. Treasury yield is at 4.91%. The numbers on the right refer to a less positive scenario: S&P 500 earnings are up by 1.10%, and the 10-year U.S. Treasury yield is at 5.47%.
The second scenario takes us to a fair price for the S&P 500 of 2,015.07, which is 58.18% down from the most recent high. The video linked below discusses these simulations, some of the most recent values for the simulation inputs, and a few other things.
The figure below shows two simulation-based valuations of the S&P 500. They assume a fair price-to-earnings (PE) ratio for the S&P 500 that is the inverse of half of the 10-year U.S. Treasury yield. The price (at the top) is the most recent top value of the S&P 500.
The numbers on the left consider a more benign scenario: S&P 500 earnings in 2023 are up by 3.20% from the previous year, and the 10-year U.S. Treasury yield is at 4.62%. The numbers on the right refer to a less positive scenario: S&P 500 earnings are up by 1.20%, and the 10-year U.S. Treasury yield is at 5.48%.
The second scenario takes us to a fair price for the S&P 500 of 2,012.28, which is 58.24% down from the most recent high. The video linked below discusses these simulations, some of the most recent values for the simulation inputs, and a few other things.
The figure below shows two main graphs. The graph at the top shows the Fed funds rate from 1978 to 1987, approximately the period in which Paul Volcker served as Chair of the Federal Reserve. Rate hikes preceded the 1980 recession. Rates were raised again around 1981, then reduced, and then raised again; leading to the 1981-1982 recession.
The graph at the bottom shows the U.S. 10 Year Treasury yield, the CPI inflation rate (left scale), and the value of the S&P 500 index (right scale). Note that the U.S. 10 Year Treasury yield generally followed the Fed funds rate in the period, and that both were high while CPI inflation was still within approximately two-thirds of its previous peak. Interestingly, the S&P 500 was mostly flat during this period of major turmoil.
Could one conclude that the Fed’s current hiking cycle to combat inflation may have a similar outcome – i.e., a period where the S&P 500 is mostly range-bound? While it is possible that the answer to this question is “yes”, there is a big difference between today and the 1980s, namely valuations. The figures below show the valuations in the 1980s and now.
As you can see, valuations in the 1980s during the two recessions were largely below 10, whether we look at the S&P 500 PE ratio or the corresponding inflation-adjusted Shiller PE10 ratio. Today they are slightly above 20 (PE ratio) and 27 (PE10 ratio). The video linked below discusses these and related issues, as well as some recent developments.
The figure below shows two simulation-based valuations of the S&P 500. They assume a fair price-to-earnings (PE) ratio for the S&P 500 that is the inverse of half of the 10-year U.S. Treasury yield. The price (at the top) is the most recent top value of the S&P 500.
The numbers on the left consider a more benign scenario: S&P 500 earnings in 2023 are up by 4.70% from the previous year, and the 10-year U.S. Treasury yield is at 3.73%. The numbers on the right refer to a less positive scenario: S&P 500 earnings are up by 4.70%, and the 10-year U.S. Treasury yield is at 4.30%.
The second scenario takes us to a fair price for the S&P 500 of 2,537.50, which is 47.34% down from the most recent high. The video linked below discusses these simulations, some of the most recent values for the simulation inputs, and a few other things.
The figure below shows two simulation-based valuations of the S&P 500. They assume a fair price-to-earnings (PE) ratio for the S&P 500 that is the inverse of half of the 10-year U.S. Treasury yield. The price (at the top) is the most recent top value of the S&P 500.
The numbers on the left consider a rather benign scenario: S&P 500 earnings in 2023 are up by 4.70% from the previous year, and the 10-year U.S. Treasury yield is at 3.49%. The numbers on the right refer to a more likely scenario: S&P 500 earnings are up by 4.70%, and the 10-year U.S. Treasury yield is at 4.22%.
The second scenario takes us to a fair price for the S&P 500 of 2,667.12, which is 44.65% down from the most recent high. The video linked below discusses these simulations, some of the most recent values for the simulation inputs, and a few other options.
The figure below shows two simulation-based valuations of the S&P 500. They assume a fair price-to-earnings (PE) ratio for the S&P 500 that is the inverse of half of the 10-year U.S. Treasury yield. The price (at the top) is the most recent top value of the S&P 500.
The numbers on the left consider a rather benign scenario: S&P 500 earnings in 2022 are up by 5.60% from the previous year, and the 10-year U.S. Treasury yield is at 3.75%. The numbers on the right refer to a more likely scenario: S&P 500 earnings are up by 3.10%, and the 10-year U.S. Treasury yield is at 4.00%.
The second scenario takes us to a fair price for the S&P 500 of 2,644.39, which is 45.12% down from the most recent high. The video linked below discusses these simulations, some of the most recent values for the simulation inputs, and a few other options.
The figure below shows two simulation-based valuations of the S&P 500. They assume a fair price-to-earnings (PE) ratio for the S&P 500 that is the inverse of half of the 10-year U.S. Treasury yield. The price (at the top) is the most recent top value of the S&P 500.
The numbers on the left consider a rather benign scenario: S&P 500 earnings in 2022 are up by 10% from the previous year, and the 10-year U.S. Treasury yield is at 3.00%. The numbers on the right refer to a more likely scenario: S&P 500 earnings are up by 5%, and the 10-year U.S. Treasury yield is at 4.00%.
The second scenario takes us to a fair price for the S&P 500 of 2,693.12, which is 44.11% down from the most recent high. The video linked below discusses these simulations, some of the most recent values for the simulation inputs, and a few other options.
The figure below shows two simulation-based valuations of the S&P 500. They assume a fair price-to-earnings (PE) ratio for the S&P 500 that is the inverse of half of the 10-year U.S. Treasury yield. The price (at the top) is the most recent top value of the S&P 500.
The numbers on the left consider a rather benign scenario: S&P 500 earnings in 2022 are up by 10% from the previous year, and the 10-year U.S. Treasury yield is at 2.50%. The numbers on the right refer to a more likely scenario: S&P 500 earnings are down by 10%, and the 10-year U.S. Treasury yield is at 3.50%.
The second scenario takes us to a fair price for the S&P 500 of 2,638.16, which is 45.25% down from the most recent high. A sobering thought, given the rally that we are in right now, which many believe to be nothing more than another bear market rally.