Summary
- ALB is a multinational producer of specialty chemicals, and the largest provider of lithium for electric vehicle batteries ().
- In this post we provide a simulation-based (sim-based) valuation () of ALB.
- At the time of this writing, the company had a trailing twelve months price-to-earnings ratio of 38.
- According to our sim-based analysis, the fair price-to-earnings ratio should be 63.57, leading to a current fair value of $393.14.
- ALB currently trades at $235.00, so it appears to be undervalued, with a potential upside of 67.23%.
- The above assumes an earnings growth rate of 43.85% per year going forward.
Albemarle Corporation (ALB)
ALB is a multinational producer of specialty chemicals, and the largest provider of lithium for electric vehicle batteries in the world (). Headquartered in Charlotte, North Carolina, the company operates in three main areas: Lithium and Advanced Materials, Bromine Specialties, and Refining Solutions. It serves several sectors, including: petroleum refining, consumer electronics, energy storage, construction, automotive, lubricants, and pharmaceuticals.
Estimating a fair value for the stock
In this post we provide a simulation-based (sim-based) valuation () of ALB.
At the time of this writing the company had a profit margin of 21.78% and a price-to-earnings ratio of 38. The expected growth in earnings for the next 5 years is not clear; but recent trends in electric vehicle adoption projections suggest enormous potential. We will assume an earnings growth rate of 43.85%, which is the expected growth rate for the coming year, to be the sim-based earnings growth rate for the next 5 years.
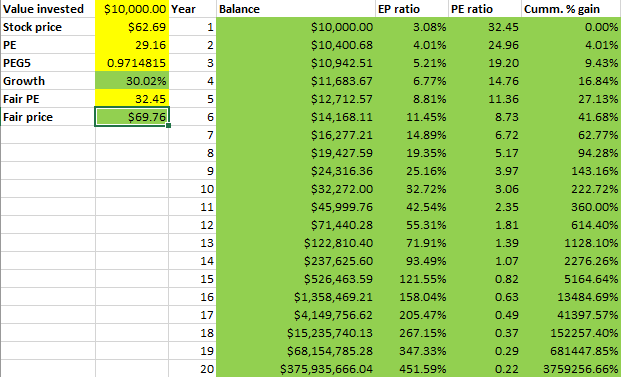
The table below summarize our sim-based results.

Since our sim-based analysis uses a S&P 500 return as a basis, our results summarized on the table above suggest the following fair values – stock price: $393.14, and price-to-earnings ratio: 63.57. At the time of this writing, ALB trades at $235.00, so it appears to be undervalued, with a potential upside of 67.23%. Yes, the company seems to be undervalued at the moment, even though its shares gained more than 150% in the last 12 months.
Final thoughts
Analysts have been slow to increase their fair value estimates for ALB, consistently lagging the market in this respect. For example, one of the highest fair value estimates at the moment is $250.00, by BMO Capital. There are many reasons for this disconnect, including: the expectation that supply of lithium will surpass demand, destroying profit margins; the possible availability of batteries using little or no lithium; and a decrease in demand for ALB’s other specialty chemicals.
ALB’s guidance tends to be conservative. Based on that, and other factors, the forward predicted price-to-earnings ratio is at the moment estimated to be 75, which does not look very good compared to the trailing twelve months price-to-earnings ratio of 38. However, the most recent (previous quarter) forward price-to-earnings ratio was 52, which turned out to be a poor predictor and much higher than the current 38.
Disclosure
The author owns ALB shares at the time of this writing.