Summary
- ViacomCBS (VIAC) is a multinational mass media conglomerate headquartered in New York City. It was formed as a result of the merger of CBS Corporation and Viacom in late 2019 ().
- In this post we provide a simulation-based (sim-based) valuation () of VIAC.
- We set our sim-based estimated earnings growth rate for the next 5 years to be 30%. This is approximately twice the consensus among sell-side analysts, which we see as conservative.
- Our results suggest the following fair values – stock price: $69.76, and price-to-earnings ratio: 32.45.
- VIAC trades at about $62.69 at the time of this writing, so it appears to be undervalued, with a potential upside of a little more than 11.27%.
- If earnings growth rate for the next 5 years turns out to be 35% (instead of the 30% we used), our simulation suggests the following fair values – stock price: $89.09, and price-to-earnings ratio: 41.44.
ViacomCBS (VIAC)
ViacomCBS is a multinational mass media conglomerate headquartered in New York City (). It was formed as a result of the merger of CBS Corporation and Viacom in late 2019. The company owns, among other highly valuable properties, the film studio Paramount Pictures, CBS Television Studios, CBS Television Stations, MTV, Nickelodeon, BET, Comedy Central, and Showtime. Valuable sports rights owned include the NFL, the NCAA's March Madness, and college football.
Estimating a fair value for the stock
In this post we provide a simulation-based (sim-based) valuation () of VIAC.
At the time of this writing the company had a trailing twelve months price-to-earnings ratio of 29.16. The trailing twelve months price-to-cash flow ratio was 13.60. Earnings growth trends have been remarkably positive recently. We will set our sim-based estimated earnings growth rate for the next 5 years to be 30%. This is approximately twice the consensus among sell-side analysts, which we see as conservative.
The table below summarize our sim-based results.
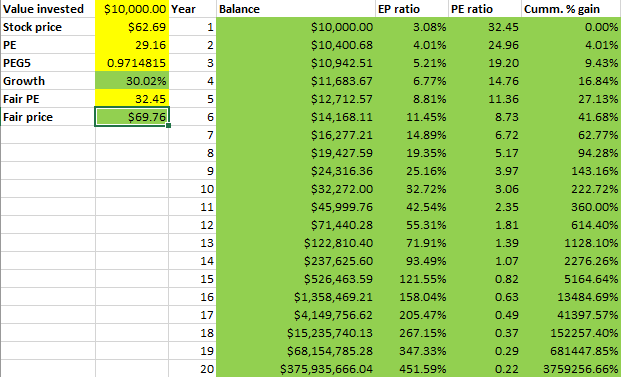
Since our sim-based analysis uses a S&P 500 return as a basis, our results summarized on the table above suggest the following fair values – stock price: $69.76, and price-to-earnings ratio: 32.45. VIAC trades at about $62.69 at the time of this writing, so it appears to be undervalued, with a potential upside of a little more than 11.27%.
Final thoughts
Discovery, Inc. (DISCA), which will soon report earnings, is very similar to VIAC in terms of balance sheet and growth prospects. Nevertheless, DISCA’s price-to-sales ratio is about twice the one for VIAC.
One could argue that sell-side analysts are underestimating the potential impact on earnings of the COVID reopening with respect to the NFL, the NCAA's March Madness, and college football. If earnings growth rate for the next 5 years turns out to be 35% (instead of the 30% we used), our simulation suggests the following fair values – stock price: $89.09, and price-to-earnings ratio: 41.44.
Disclosure
The author owns VIAC shares at the time of this writing.


