Summary
- DXC Technology (DXC) is a technology consulting and services company headquartered in Tysons, Virginia ().
- Launched in April of 2017, DXC was created from the merger of Computer Sciences Corporation (CSC) and the Enterprise Services division of Hewlett Packard Enterprise (HPE).
- In this post we provide a simulation-based (sim-based) valuation () of DXC.
- Our results suggest the following fair values – stock price: $70.21, and price-to-earnings ratio: 7.65.
- DXC currently trades at $36.86, so it appears to be undervalued, with a potential upside of 90.48%.
DXC Technology (DXC)
DXC Technology (DXC) is a technology consulting and services company headquartered in Tysons, Virginia. Launched on April 3, 2017, DXC was created from the merger of Computer Sciences Corporation (CSC) and the Enterprise Services division of Hewlett Packard Enterprise (HPE).
The company operates in more than 70 countries, and counts among its customers several federal and regional government agencies. In many ways DXC is similar to Accenture (ACN). In fact, DXC has had since September 2019 a new CEO, Mike Salvino, who previously served as group CEO for Accenture Operations.
Estimating a fair value for the stock
In this post we provide a simulation-based (sim-based) valuation () of DXC.
At the time of this writing the company had a negative net profit margin of -15.67% and a price-to-sales ratio of 0.48. The company has great growth potential, as long as it transitions from legacy technology services to more modern and narrow offerings (e.g., cloud applications, security consulting). This transition seems to be a major focus of the new CEO.
To be somewhat conservative, we will use recent numbers from Accenture to set our sim-based estimated earnings growth rate for the next 5 years (1.24%) and net profit margin (11.95%). We believe this to be a conservative approach because DXC is much smaller than Accenture; e.g., DXC’s revenues are less than half of Accenture’s.
Another reason why we believe the above is a conservative approach is that it is quite possible that in the near future earnings growth will be much higher than it is now. Sales are likely to go up, and so should earnings – the latter at a faster pace, leading to higher margins for many of DXC’s services (the same goes for Accenture).
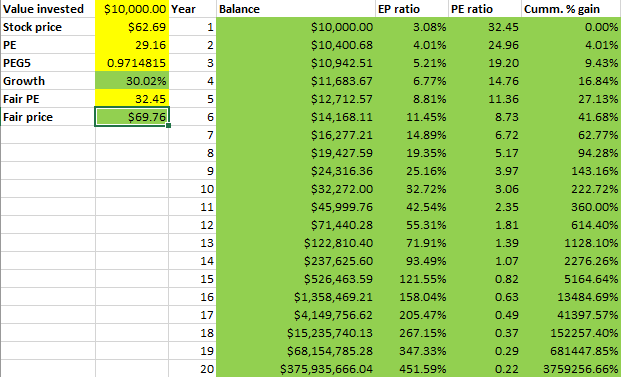
The table below summarize our sim-based results.

Since our sim-based analysis uses a S&P 500 return as a basis, our results summarized on the table above suggest the following fair values – stock price: $70.21, and price-to-earnings ratio: 7.65. At the time of this writing, DXC trades at $36.86, so it appears to be undervalued, with a potential upside of 90.48%. In fact, the company seems to be quite undervalued at the moment, even though its shares gained more than 100% in value in the last 12 months.
Note that we assumed a positive net profit margin of 11.95% for a company that actually has a net profit margin of -15.67%. This type of assumption is useful in valuing growing companies that have a negative profit margin, which is often the case with companies that have been experiencing problems and are turning around; as well as high-growth companies that have been publicly-traded for only a few years.
Other pluses and minuses
About a year ago, DXC paid an attractive dividend of 5.11%, significantly higher than the average S&P 500 dividend at the time. We thought then that the dividend was relatively safe, but the COVID recession proved us wrong. That dividend was cut to zero in response to the recession, and still no dividend was being paid at the time of this writing.
While somewhat leveraged, DXC has a reasonably attractive balance sheet, with EBITDA in the neighborhood of $2.53 billion. This, added to its cash position of $3.92 billion, is fairly close to its $7.80 billion dollar debt. So, DXC is leveraged, but much less so than many other companies with much higher valuations.
Disclosure
The author owns DXC shares at the time of this writing.